optmulti
Important
The libraries matplotlib and plotly should be installed.
Generate an interactive figure for a multiple gaussian output calculation including key convergence variables of an optimization.
usage: pyssianutils plot optmulti [-h] [--outfile [OUTFILE]] [--browser]
                                  files [files ...]
Positional Arguments
- files
Gaussian Output Files
Named Arguments
- --outfile
Output html file where the interactive figure will be written to
Default:
'screen.html'- --browser
If enabled instead of saving to a file it will open a browser window and show the figure. To exit the process in the terminal remember to Ctrl+C
Default:
False
Examples
The main use-case of this util is to quickly visualize the status of the convergence of multiple geometry optimizations, simultaneously visualizing the thresholds for convergence and the various parameters used to assess convergence, including the potential energy. For this use case
For an interactive view (running a command that will prompt a window with the figures that allows us to zoom in at will):
$ pyssianutils plot optmulti example.log example2.log --browser
Opening in existing browser session.
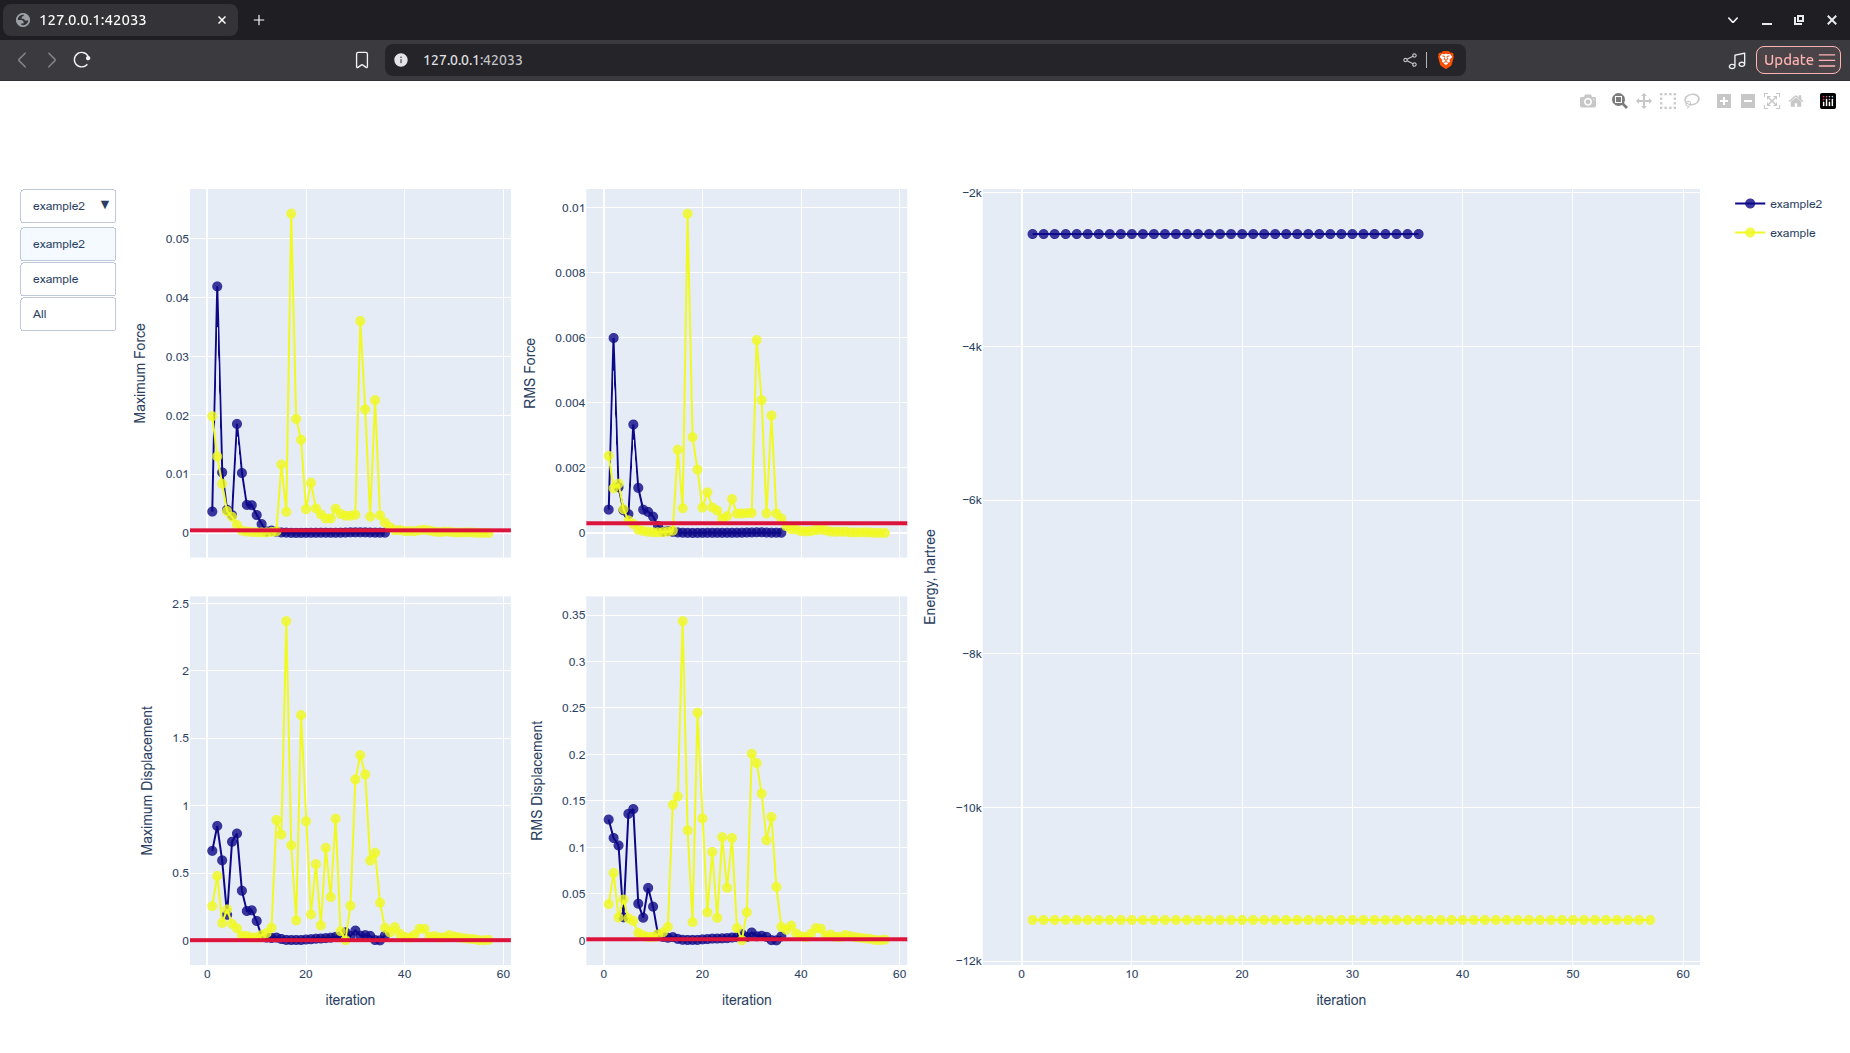
We can notice a dropdown menu on the left allows us to select a specific calculation, which cleans all the figures and only displays the information of the one that we selected:
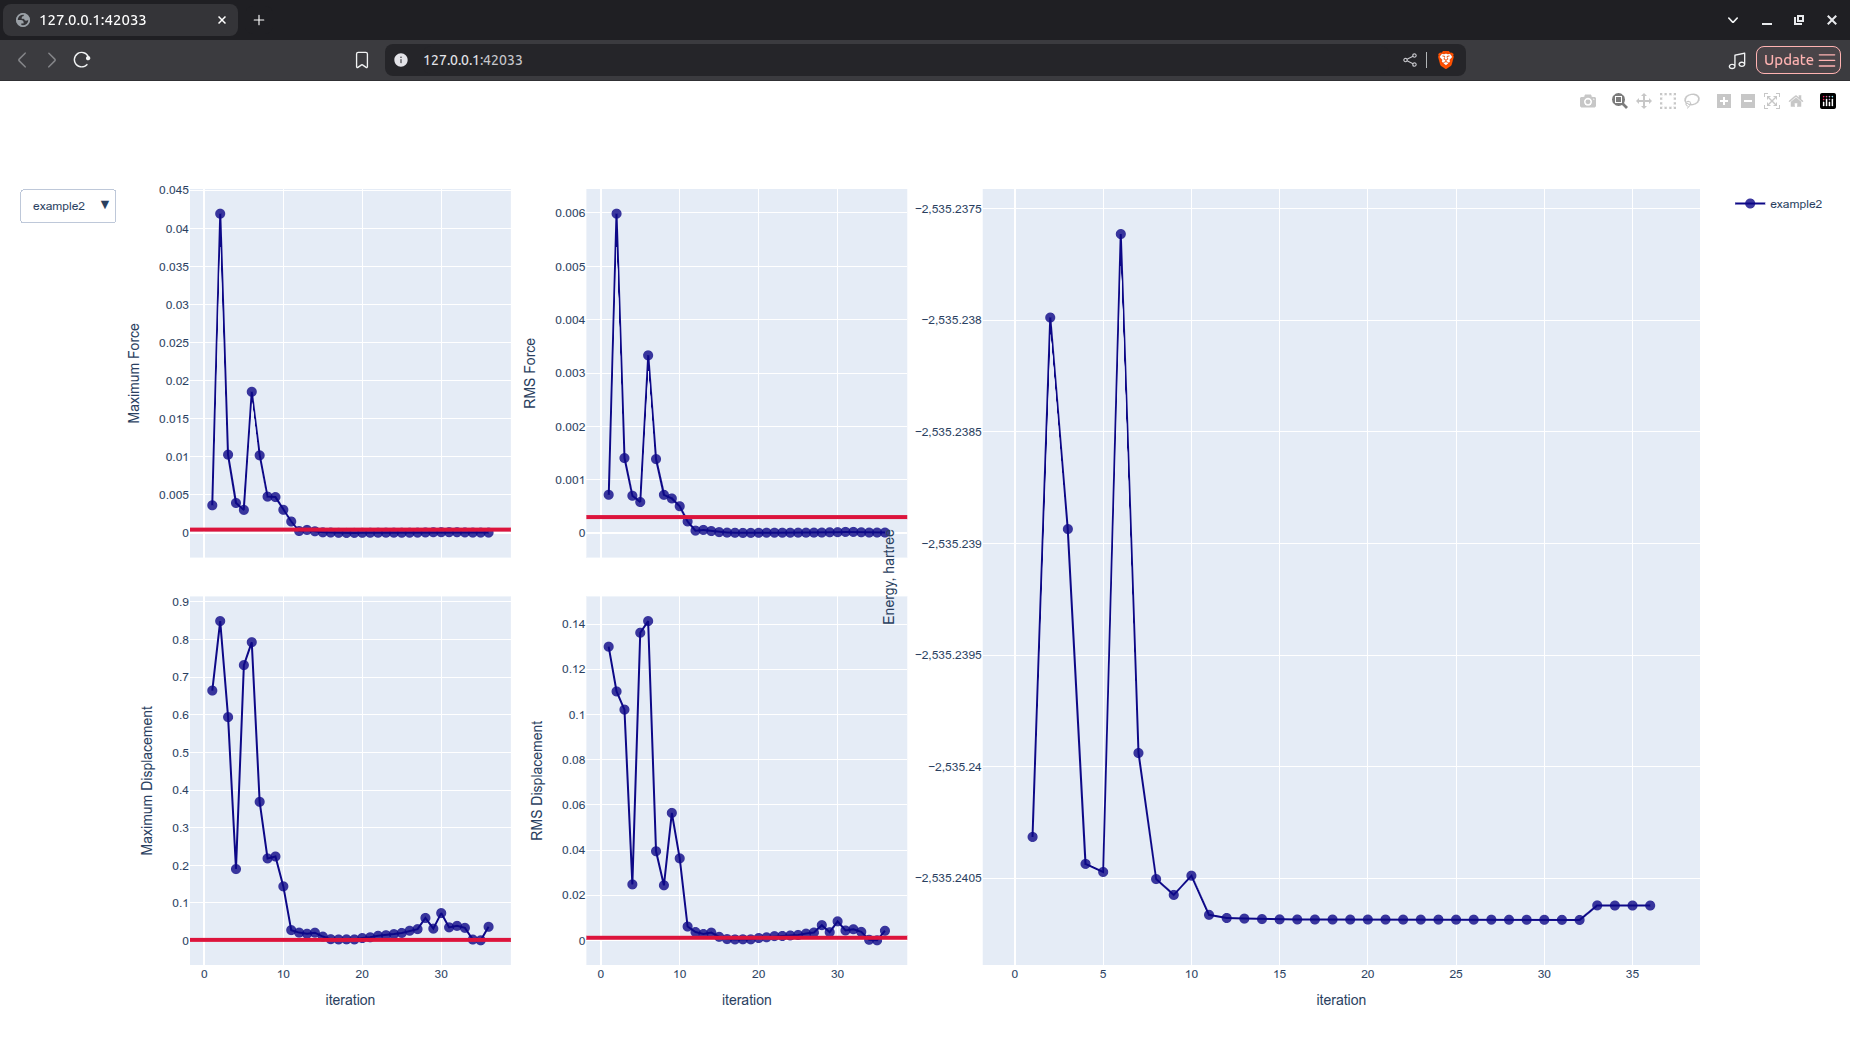
We can also do the same action by clicking on the legend at the right. On each of the plots we can zoom in, if we have troubles seeing the data and the x-axis will sincronize across the various figures. This can be usefull for selecting an appropriate geometry to re-start a calculation as we can visually inspect which geometries were the closest to converging.