property
Generate a quick figure for a single property of a single gaussian output calculation file.
Currently 3 possible "properties" may be drawn:
energy
usage: pyssianutils plot property energy [-h] [--outfile OUTFILE]
                                         [--interactive] [--include-scf]
                                         [--method {oniom,mp2,mp2scs,mp4,ccsdt,default}]
                                         ifile
Positional Arguments
- ifile
Gaussian Output File
Named Arguments
- --outfile
Output image file
Default:
screen.png- --interactive
Instead of writing to a file open a window showing the figure
Default:
False- --include-scf
include the energies of each step of the SCF cycles
Default:
False- --method
Possible choices: oniom, mp2, mp2scs, mp4, ccsdt, default
When not provided it will attempt (and may fail) to guess the method used for the calculation to correctly read the potential energy of each step. If it fails it defaults to the Energy of the 'SCF Done:'
Default:
default
parameter
usage: pyssianutils plot property parameter [-h] [--outfile OUTFILE]
                                            [--interactive]
                                            ifile name
Positional Arguments
- ifile
Gaussian Output File
- name
Name of the parameter. For the available options please look at the definitions on your file using 'pyssianutils others track'
Named Arguments
- --outfile
Output image file
Default:
screen.png- --interactive
Instead of writing to a file open a window showing the figure
Default:
False
geometry
usage: pyssianutils plot property geometry [-h] [--outfile OUTFILE]
                                           [--interactive]
                                           ifile atoms [atoms ...]
Positional Arguments
- ifile
Gaussian Output File
- atoms
Atom numerical ids following the convention: first atom = 1
Named Arguments
- --outfile
Output image file
Default:
screen.png- --interactive
Instead of writing to a file open a window showing the figure
Default:
False
Examples
All these tools are thought for quick visualizations of key properties. Specifically the potential energy, or any geometrical parameter (either an internal coordinate or some other distance/angle/dihedral).
For all the following examples we will assume that there is a file named
Example.log containing a gaussian optimization.
To draw the potential energy of Example.log:, which might give us some
insight into the convergence the optimization job:
$ pyssiantuils plot property energy Example.log --interactive
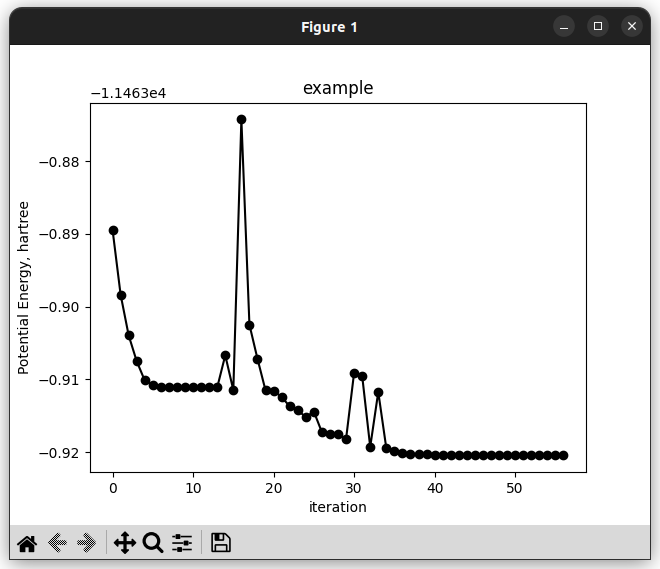
which shows the "interactive" plot where we can zoom in/out at will. If we
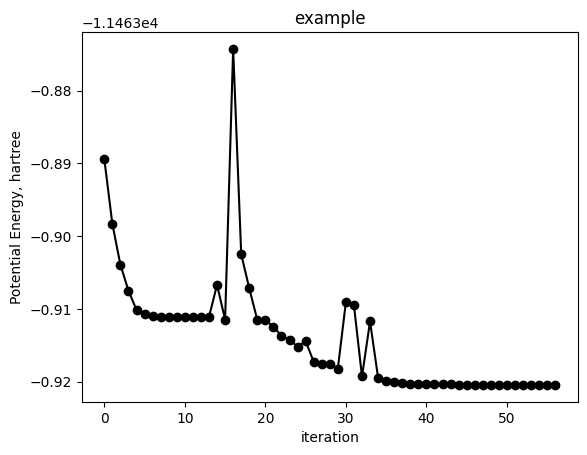
instead prefer to generate a png for later inspection we should omit the
--interactive flag. This will lead to the generation of an image file
with a default name, or if we want to specify the name we can enable the
--outfile flag.
$ pyssiantuils plot property energy Example.log --outfile example.png
writing -> example.png
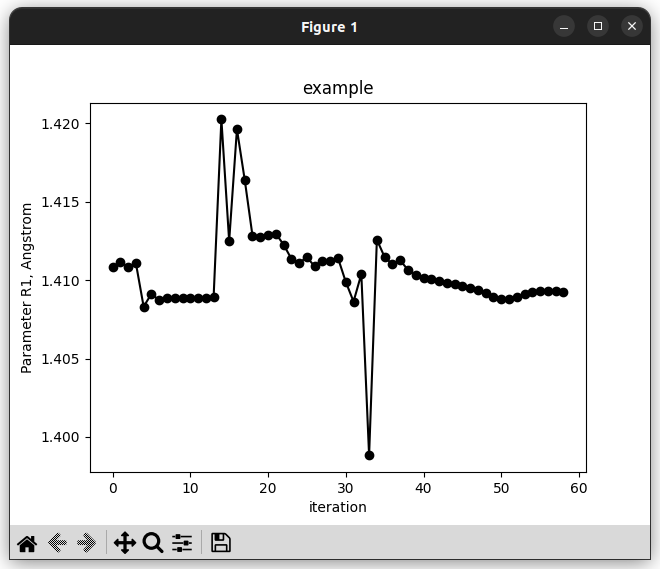
For a given internal parameter (we can visualize the defined parameters
for a given file using pyssianutils others track, see
others)
$ pyssiantuils plot property parameter Example.log R1 --interactive
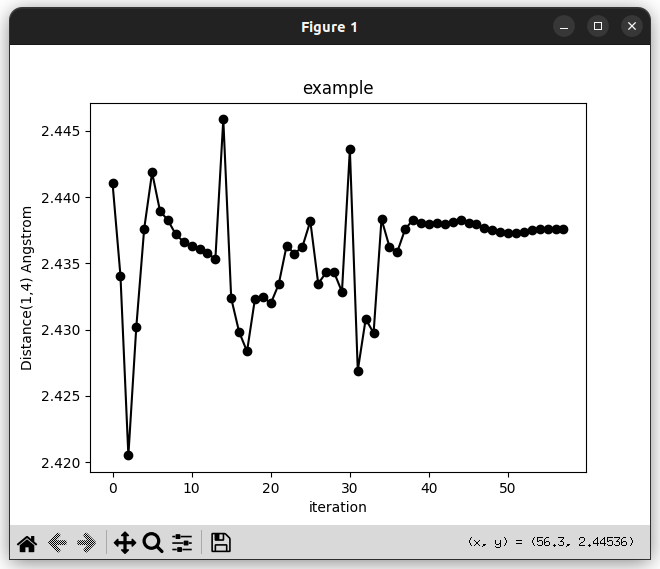
Or if we are interested in a geometrical parameter and we are not sure if it
is part of the internal coordinates, we can instead use plot geometry
where we will specify the indices of the involved atoms. Specifying 2 atoms will
give us a distance, 3 an angle, and 4 a dihedral angle.
$ pyssiantuils plot property geometry Example.log R1 1 4 --interactive