optview
Generate a figure for a single gaussian output calculation including key convergence variables of an optimization.
usage: pyssianutils plot optview [-h] [--outfile [OUTFILE]] [--width WIDTH]
                                 [--height HEIGHT] [--dpi DPI] [--interactive]
                                 ifile
Positional Arguments
- ifile
Gaussian Output File
Named Arguments
- --outfile
Output image file
Default:
screen.png- --width
figure width in inches (default 12.0)
Default:
12.0- --height
figure height in inches (default 6.0)
Default:
6.0- --dpi
Figure's Dots Per Inch (default 300.0)
Default:
300.0- --interactive
Instead of writing to a file open a window showing the figure
Default:
False
Examples
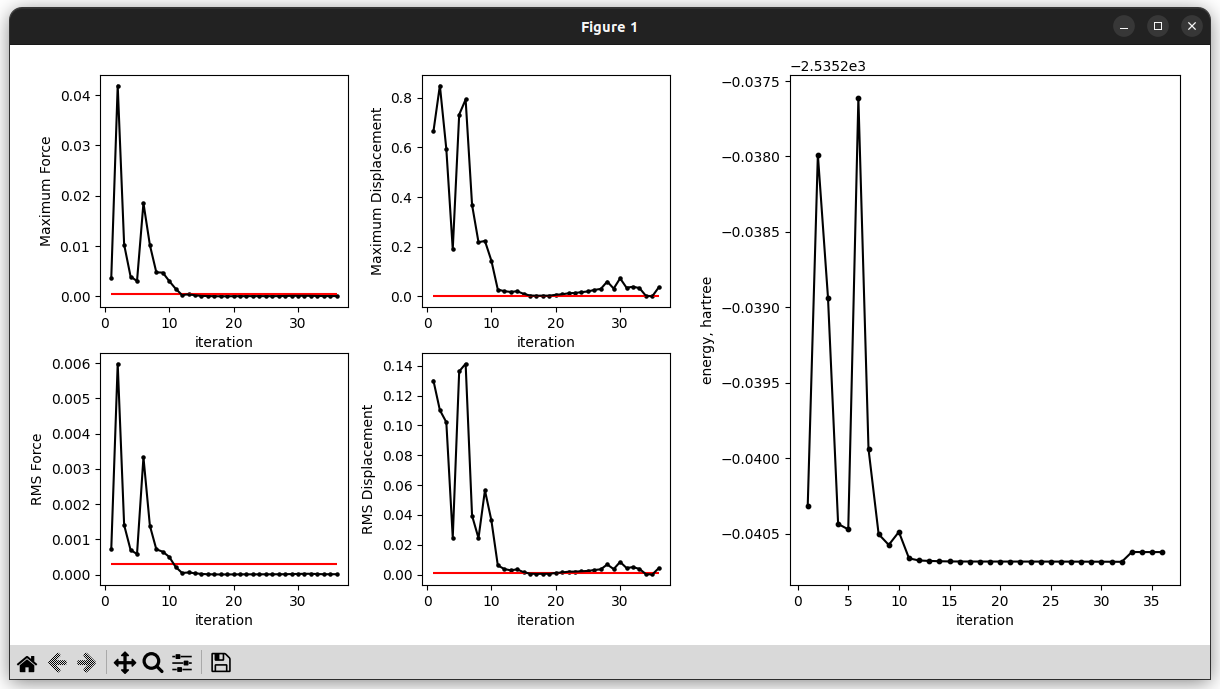
The main use-case of this util is to quickly visualize the status of the convergence of a geometry optimization, simultaneously visualizing the thresholds for convergence and the various parameters used to assess convergence, including the potential energy. If instead multiple calculations want to be inspected we recommend using instead optmulti
For an interactive view (running a command that will prompt a window with the figures that allows us to zoom in at will):
$ pyssianutils plot optview Example.log --interactive
Note
As of now we have more or less patched the interactive view of the figure to not look horrible. However, for those users that aesthetics of the generated figure are important we recommend the generation of the image file and then visualizing it.